Average prices by Dubai district: AED 1 301 a foot in JVC to 2 433 in Downtown
Five districts generate more than 60% of all location searches in the emirate. Their average price per square foot, and the single most useful thing to do with the table: test a developer’s price against the established market.
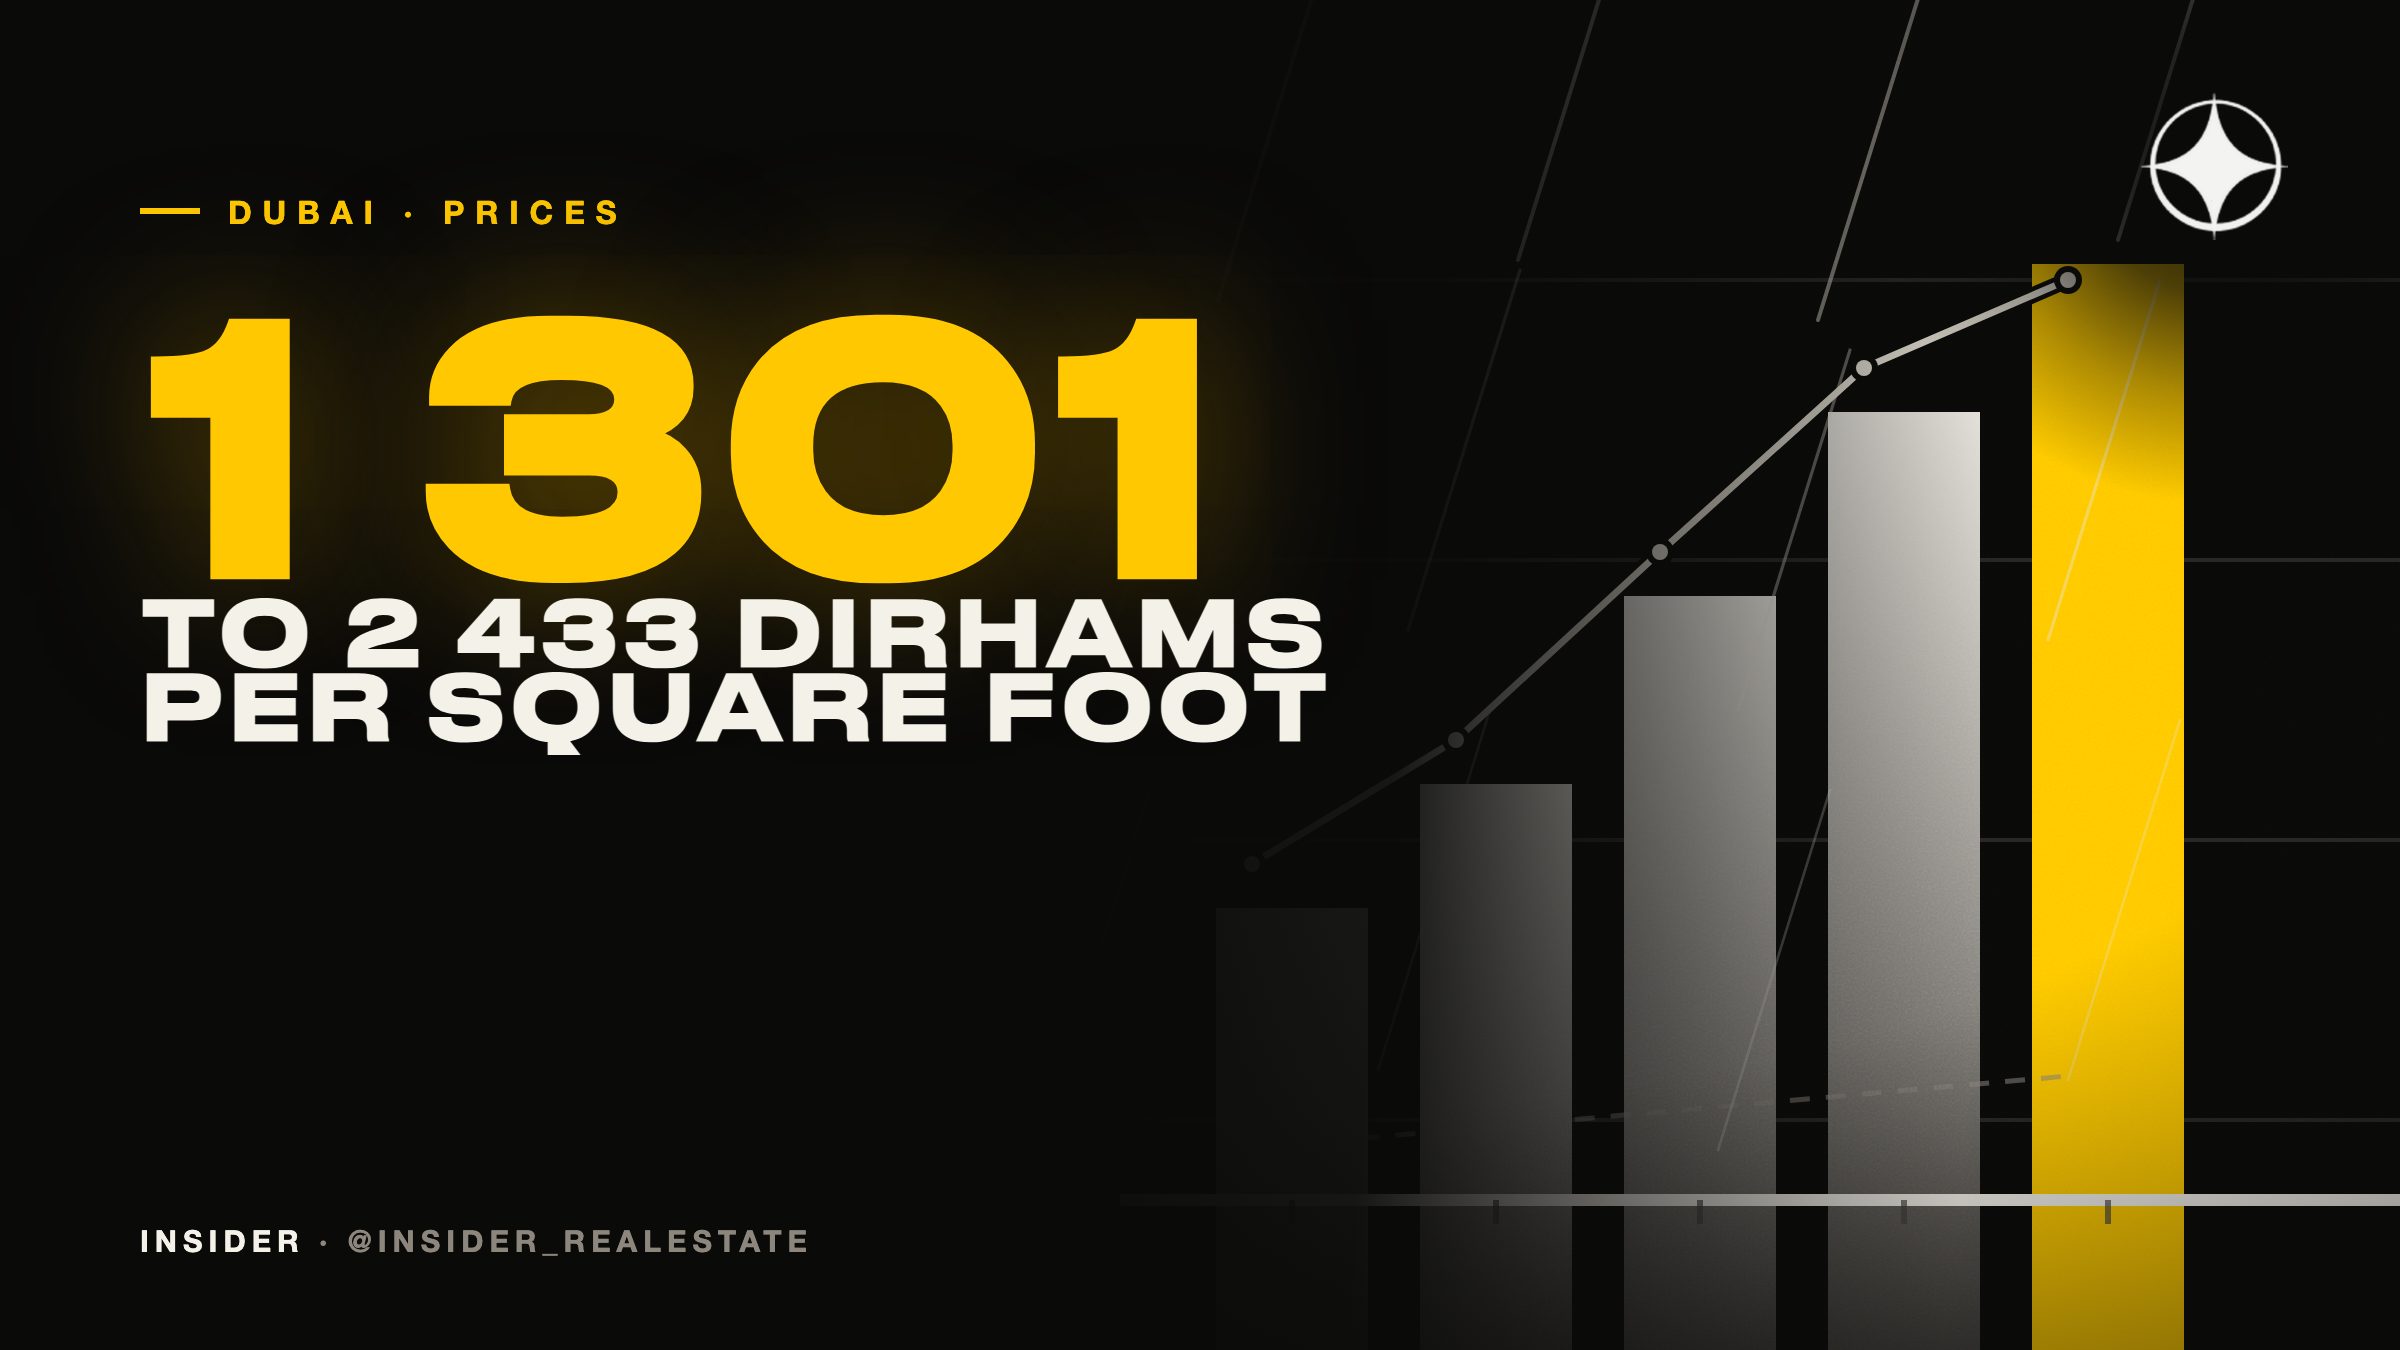
Search statistics by Dubai district are a rare case of data showing what people are looking for rather than what is being sold. Five districts account for more than 60% of all location-related searches in the emirate. Here is what a square foot costs in each.
| District | AED per ft² |
|---|---|
| JVC | 1 301 |
| Dubai Marina | 1 845 |
| Business Bay | 1 871 |
| Dubai Hills Estate | 2 313 |
| Downtown Dubai | 2 433 |
How to use this table
Its most useful application is testing a developer's price list. Take the price per foot of the off-plan scheme you are looking at and put it next to the average for its district. In a great many cases the new-build turns out to be more expensive than the established market — sometimes considerably.
That is not a verdict. Above average can be entirely justified. But the question has to be asked directly: what exactly is the difference buying?
Talk to a licensed broker: 📲 +971 50 120 32 64 on WhatsApp, @dubai_oleg on Telegram
- Position inside the district. First row on the canal and the second street back from Al Khail Road are the same district and different assets.
- The developer's name. Sometimes a demonstrated delivery record, sometimes only marketing.
- The product. Layout efficiency, ceiling height, the specification you actually receive, and the amenity package you will be funding through the service charge.
- The payment plan. Money paid in year four is cheaper than money paid today, and a back-loaded schedule is worth a premium on the sticker.
What the table does not tell you
An average across a district conceals a spread that is frequently twofold inside it. In Business Bay a canal-facing floor in a new tower and a low floor in a fifteen-year-old building sit in the same average and in different markets. Use the figure as a sanity check on the order of magnitude, and comparable transactions for anything more precise.
The second limitation: these are asking-price averages by district, not registered transactions. In a slower market the gap between the two widens, and it widens most in exactly the districts with the most new supply.
Video on this topic
The same subject on the English channel — each clip has a written version of its own.
 0:59
0:59 Dubai's Quality of Life Strategy 2033: The Walkable Districts
Two kilometres of air-conditioned, glazed elevated walkways around Emirates Towers, plus a new waterfront district in Deira — this is what Dubai's Quality of Life Strategy 2033 is actually building.
WatchIn the news
Other write-ups on the site about the same thing.

Emirates Hills: 632 villas, plots sold by the foot, and a market of eleven sales in six months
The only Emaar project where land was sold to buyers to build on themselves. How Dubai’s most expensive villa community works, why prices inside it differ thirtyfold, and what to do with statistics drawn from eleven transactions.
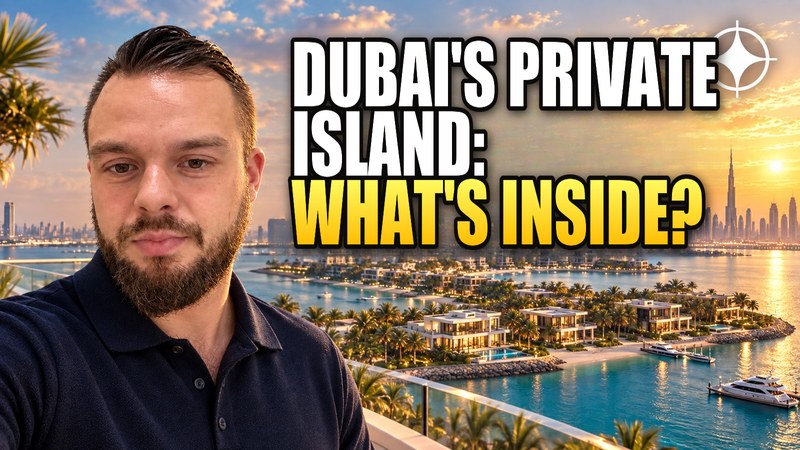
Jumeirah Bay Island: 128 plots shaped like a seahorse, and a market of a few sales a year
A Meraas island off Jumeirah Beach Road: 128 plots for bespoke villas, the Bulgari resort and residences, and the Bulgari Lighthouse tower. How Dubai’s most private address works, and why record prices there describe a deal rather than a market.
Jumeirah Islands: 46 clusters of 16 villas, and a market with no off-plan
A gated Nakheel community on man-made islands: 736 villas, exactly 16 homes per cluster, water instead of fences between plots. Why its statistics behave differently from the rest of the Dubai market.
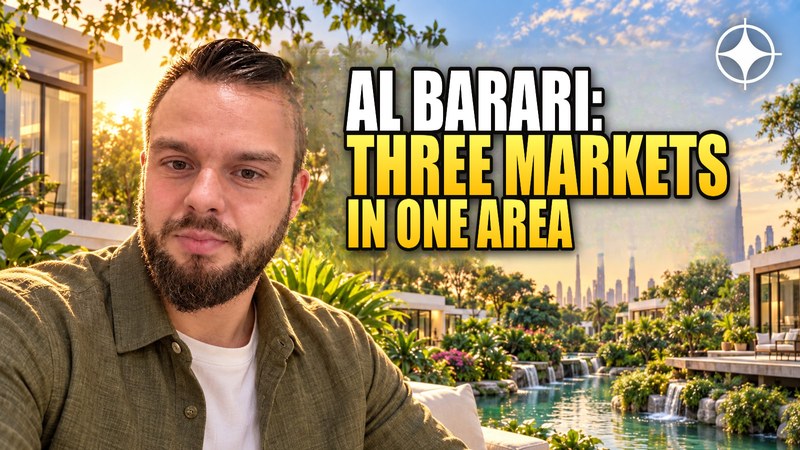
Al Barari: the greenest community in Dubai, and the three separate markets inside it
More than 60% of the site is gardens and water, and one address contains three different products — Ixora, Chorisia and the Estate Villas, with medians from AED 8.55m to AED 41.75m. Why a single average for the community means nothing.
Average or median: how to read the price of a Dubai district
The average price of a district is one of the least useful numbers published about Dubai. It moves when the mix of what sold moves, even if no property changed price — and a handful of penthouses can carry it on their own.

Meydan Horizon: not a project but an urban cluster inside MBR City
The distinction is practical: a cluster has its own master plan, its own infrastructure and its own growth logic. What is planned, how it connects, and what a crystal lagoon does to rents.
Related services
Below market in Downtown Dubai right now
From the daily off-market feed. Availability and price are confirmed on request.
All below-market listings →