
UHNWI and the migration of millionaires to Dubai
Dubai stopped being simply a market for expensive property some time ago — it became one of the places private capital collects. What follows are the numbers that show it: how many people in the world hold more than $30m and where they are moving, how the ultra segment differs from merely wealthy buyers, how behaviour itself has shifted over recent years from trophy assets to quiet luxury, how many square feet a million dollars buys in different cities, and how Dubai's market above $10m works — down to individual resales that went up and ones that went down.
The 2026 figures come from open reports by Knight Frank (Wealth Report and Wealth Sizing Model), Henley & Partners, Altrata and Haute Jets; the source is named above each panel. The slides are from my own buyer presentation, which collects 2023–2024 data: Henley & Partners, New World Wealth, Capgemini, Knight Frank, Property Monitor, DXBinteract, UBS. Each block names its year in the text — these are snapshots of the market at the time of the analysis, not today's quotes, and they cannot be stacked into one series: some count millionaires from $1m, others UHNWI from $30m.
- UHNWI in 2026: how many there are and where they are going
- Millionaire migration: who receives the capital and who loses it
- Who HNWI and UHNWI actually are
- Quiet luxury: how behaviour changed and what is bought now
- Why Dubai in particular
- Dubai’s prime market in numbers
- Resale cases: what grew and what did not
UHNWI in 2026: how many there are and where they are going
The most recent count is the twentieth Knight Frank Wealth Report, published in 2026. There are 713 626 people in the world with more than $30m. That is 32% more than in 2021: 162 191 people were added over five years, around 89 new UHNWI a day. The United States produced 41% of that growth, and its share rose from 33% to 35%.
The segment grows fastest where it is not already large. The Middle East’s share of the world’s UHNWI rises from 2.4% to 3.1% and holds at that level to 2031. The fastest-growing countries are Indonesia, Saudi Arabia, India, Poland and Vietnam; India is already sixth in the world by absolute numbers with 19 877 people, up 63% in five years.
Dubai is the main beneficiary. The number of millionaires in the city grew 102% over ten years, and the UAE is forecast to gain another 9 800 of them in 2026 along with up to $63bn of new capital. Prime residential prices in Dubai added 25.1% on the PIRI 100 index. In 2026 the city entered the world’s twenty wealthiest for the first time — a decade ago it was not in the top thirty.
The other side of the ledger is the United Kingdom. The forecast outflow for 2025 is 16 500 millionaires and $91.8bn of combined wealth; for the first time in ten years of Henley & Partners tracking, the country tops that list. The reasons are stated plainly: the end of the Tier 1 Investor Visa, the non-dom reform and inheritance tax. The UAE, meanwhile, has one of the world’s highest Wealth Mobility Competitiveness Scores at 85.3.
The move is visible in the air as well: London — Dubai is now among the ten busiest private aviation routes in the world. In 2025 there were 3.88m business jet departures globally, 34% above the pre-pandemic level, ultra-long-range activity was up 70%, and fractional flying up 75.5%.
- 713 626 UHNWI worldwide more than $30m in wealth
- +32% against 2021 +162 191 people in five years
- 89 new UHNWI a day
- 41% of the growth came from the US its share rose from 33% to 35%
The Middle East’s share of the world’s UHNWI rises from 2.4% to 3.1% and holds there to 2031. India is sixth in the world by absolute numbers: 19 877 people, up 63% in five years. The fastest-growing countries:
- 1 Indonesia
- 2 Saudi Arabia
- 3 India
- 4 Poland
- 5 Vietnam
- +102% growth in the number of millionaires in Dubai over ten years
- +9 800 new millionaires in the UAE 2026 forecast
- up to $63bn of new capital coming into the UAE 2026 forecast
- +25.1% prime residential prices in Dubai PIRI 100 index
- 3.88m business jet departures worldwide in 2025 +34% against the pre-pandemic level
- +70% ultra-long-range activity against 2019
- +75.5% growth in fractional flying against 2019
Millionaire migration: who receives the capital and who loses it
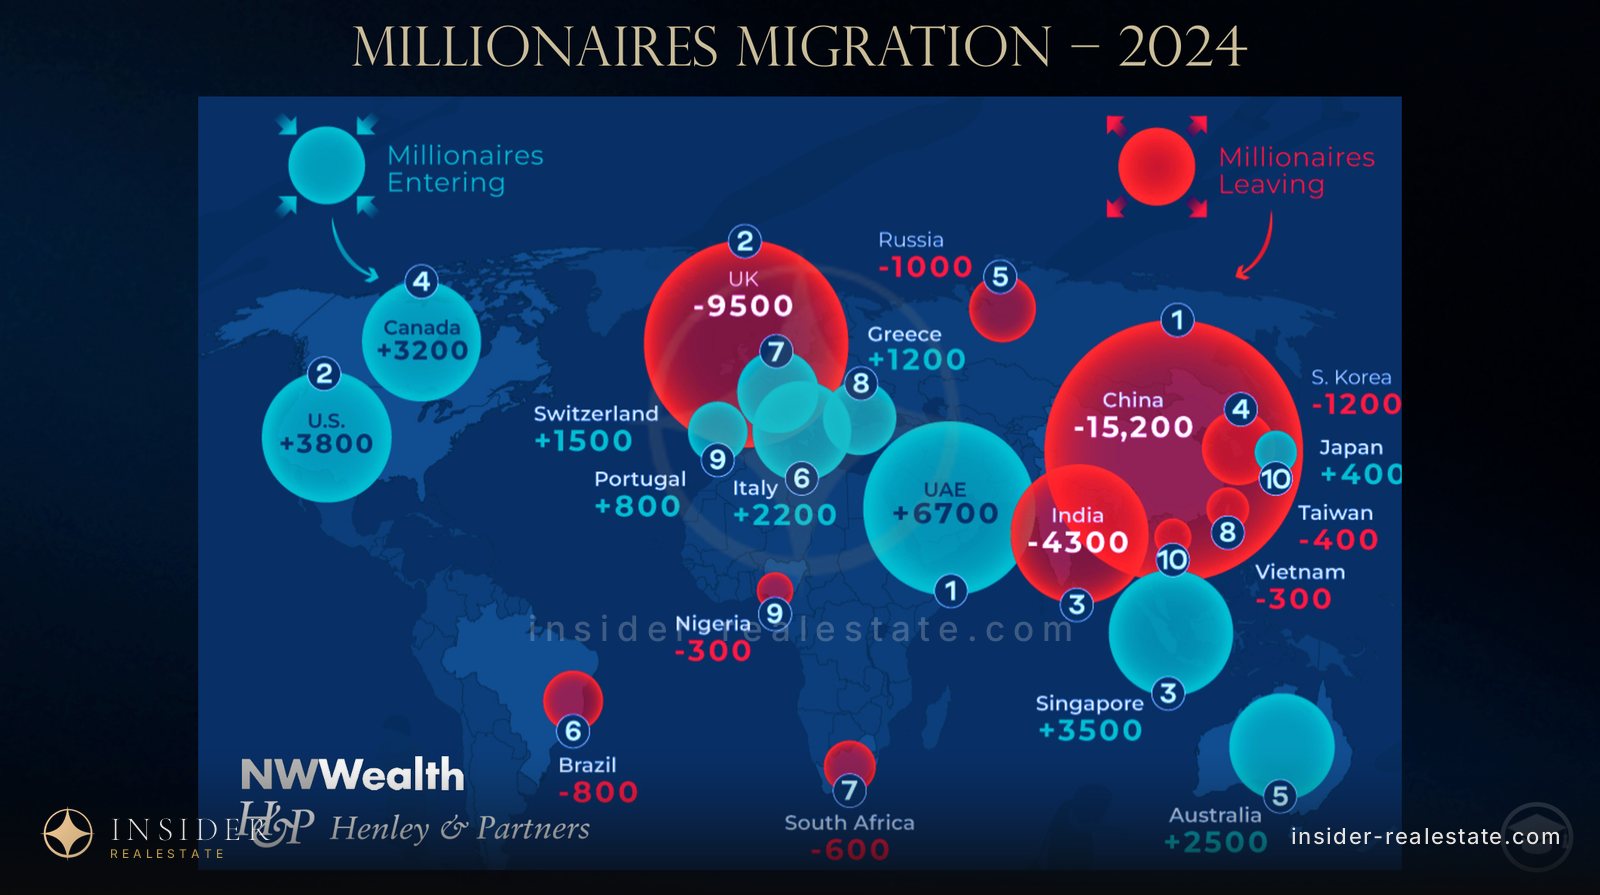
Wealthy people change country more often than ever. Henley & Partners and New World Wealth estimate that the UAE took in about 6 700 millionaires in 2024 — twice as many as the United States, second on that list with 3 800. Then come Singapore (+3 500), Canada (+3 200), Australia (+2 500) and Italy (+2 200).
At the other end are China, with an outflow of about 15 200 millionaires, and the United Kingdom with 9 500. That outflow is exactly what creates housing demand in the receiving jurisdictions: someone who moves is not buying an "investment", but the place where the family will live.
What separates the receiving countries from the losing ones is not tax as such. The "Safe Haven 8" — the UAE, Singapore, Australia, Switzerland, New Zealand, Malta, Monaco and Mauritius — share different traits: 40% or more of the population born abroad, millionaire numbers up by 35% or more over a decade, high-income status in the World Bank classification and a low rate of violent crime.
The backdrop is the growth of the class itself. Capgemini’s World Wealth Report puts the number of HNWI worldwide at 8.6m in 2008 and 22.8m in 2023 — roughly two and a half times in fifteen years. More millionaires means more deals at the top of the market, and prime housing grows behind them everywhere.
-
Where millionaires moved in 2024 Blue for inflow, red for outflow. UAE +6 700, US +3 800, Singapore +3 500; China −15 200, UK −9 500, India −4 300. Estimates by Henley & Partners and New World Wealth. -
The UAE first, by a factor of two Forecast net millionaire inflow for 2024: UAE +6 700 against +3 800 for the US. Then Singapore, Canada, Australia, Italy, Switzerland, Greece, Portugal, Japan. -
Who is losing wealthy residents Outflow: China −15 200, UK −9 500, India −4 300, South Korea −1 200, Russia −1 000. One country’s outflow is another country’s demand. -
The Safe Haven 8 The UAE, Singapore, Australia, Switzerland, New Zealand, Malta, Monaco, Mauritius. The criteria: at least 40% of the population born abroad, millionaire numbers up 35%+ over a decade, high-income status in the World Bank classification, safety. -
22.8m millionaires worldwide Capgemini World Wealth Report: 8 579k HNWI in 2008 and 22 828k in 2023, +5.1% against 2022 with average annual growth of 6.7%. The pool of top-end buyers grows faster than the supply they buy from.
Who HNWI and UHNWI actually are
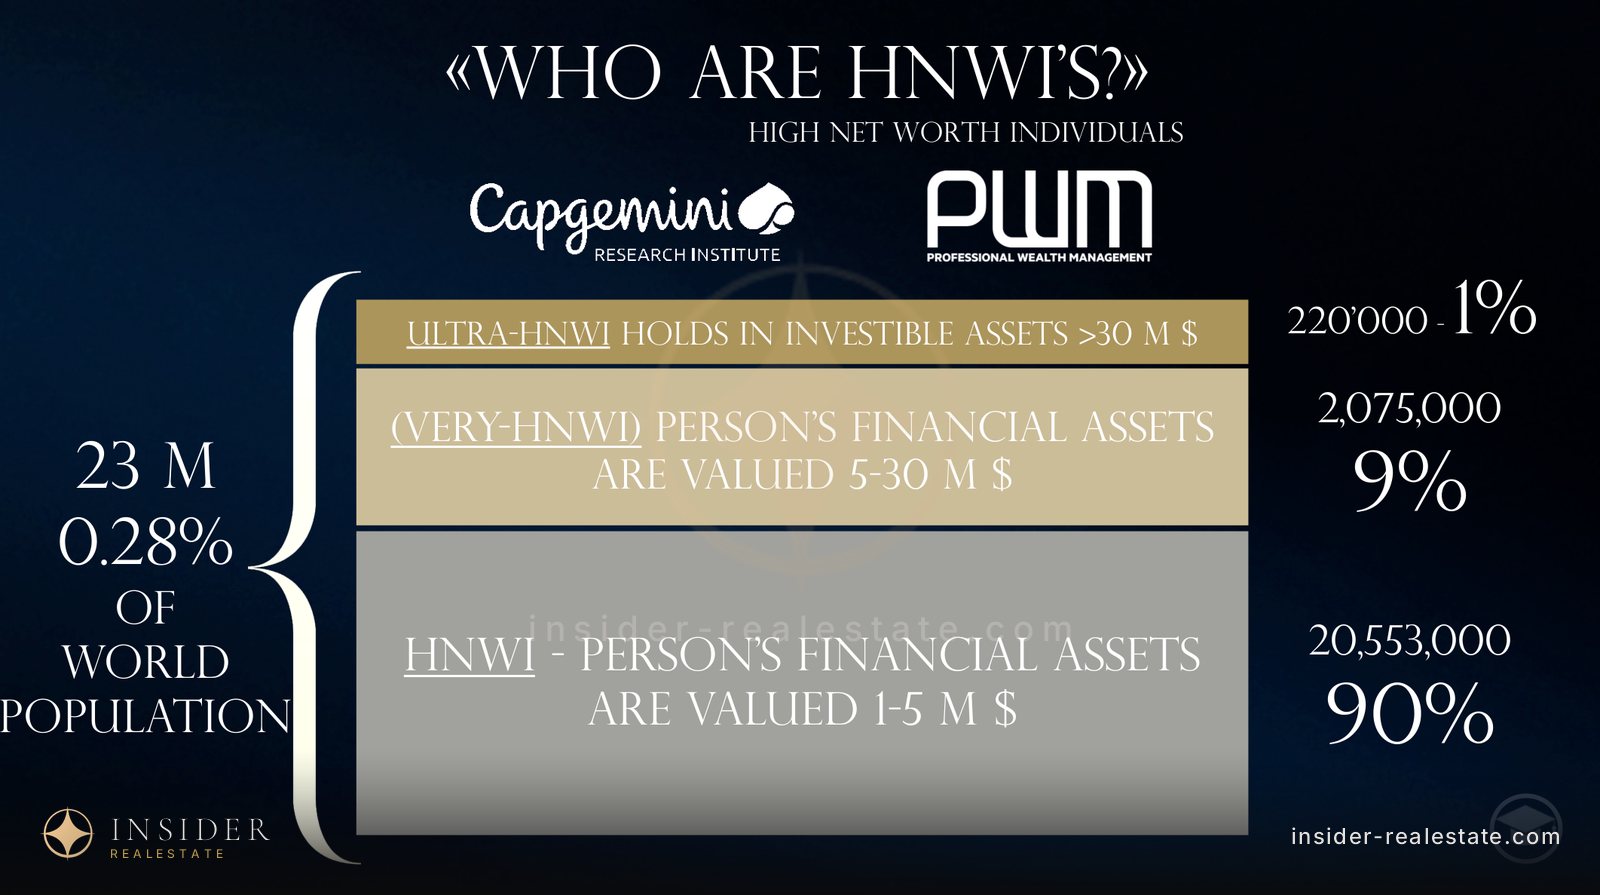
An HNWI — high net worth individual — holds between $1m and $5m in investable assets; a very-HNWI between $5m and $30m; an ultra-HNWI more than $30m. There are around 23m such people in the world, 0.28% of the planet’s population. Of them 90% sit on the first rung, 9% on the second, and 1% — some 220 000 people — in the ultra segment.
The difference between the rungs is not the number of zeros but the structure of spending. The journalist Ray Hutton describes the average UHNWI as owning eight cars, three to five homes in different countries, a yacht in most cases and, for 75% of them, an aircraft. That buyer is not choosing between an apartment in Dubai and one in London: they take both, and the only question is where the next home goes.
Property itself remains asset number one. Asked by Knight Frank what they would do with an unexpected windfall, 29.8% of wealthy respondents said they would buy prime housing — ahead of a luxury car (27.8%), an aircraft (15.1%), art (12.4%) and a superyacht (8.9%).
-
Three tiers: HNWI, very-HNWI, ultra-HNWI 23m people — 0.28% of the world’s population. 20.55m (90%) hold $1–5m, 2.08m (9%) hold $5–30m, 220k (1%) hold more than $30m. Capgemini and PWM data. -
How the ultra segment lives About 220 000 people worldwide. On average eight cars, three to five homes, a yacht in most cases and an aircraft for 75%. The wording comes from Ray Hutton’s "Jewels in the Crown". -
Property is purchase number one Knight Frank survey: 29.8% would spend an unexpected windfall on prime housing, 27.8% on a car, 15.1% on an aircraft, 12.4% on art, 8.9% on a superyacht.
Quiet luxury: how behaviour changed and what is bought now
The main shift of recent years is that the owner no longer lives in one house. Knight Frank finds that 73% of wealthy buyers hold several branded residences and only 27% a single one; a growing share spends fewer than 90 days a year in any one of them. Hence the demand for fully managed turnkey residences, ready to walk into at the push of a button, and the near-zero interest in anything that has to be looked after personally.
It works as a sales channel too: Altrata estimates that each UHNW individual knows, on average, seventy others. In this segment a recommendation outweighs any advertising, and a broker’s reputation is a working tool rather than a figure of speech.
They still spend heavily, but differently. Altrata’s priority scale is topped by cars, on the back of occasional very large purchases, followed by fine wine, private jets and yachts. At the same time $45bn a year goes into luxury hospitality and art: a shift from owning to experiencing, where art counts as both an experience and a long-term investment.
The counter-trend most visible in property is quiet wealth. Fewer trophy assets, more private ownership structures; private capital moves into climate technology, health and education. The project model changes with it: developers increasingly run the building’s ecosystem themselves rather than putting an outside hotel brand on it.
In floor plans this is literal, and our own deals show the same. The engineering disappears into the surfaces — integrated climate and lighting instead of control panels on the walls. The kitchen splits in two: a show kitchen for guests and a hidden working one. The apartment gains its own spa area and a soundproofed study for video calls. Further out is what developers are already designing into premium projects: medical zones for longevity, robotic parking galleries and planting with its own air-purification loop.
- < 90 days a year in one residence, for a growing share of owners
- 70+ other UHNW individuals each of them knows on average
Why Dubai in particular
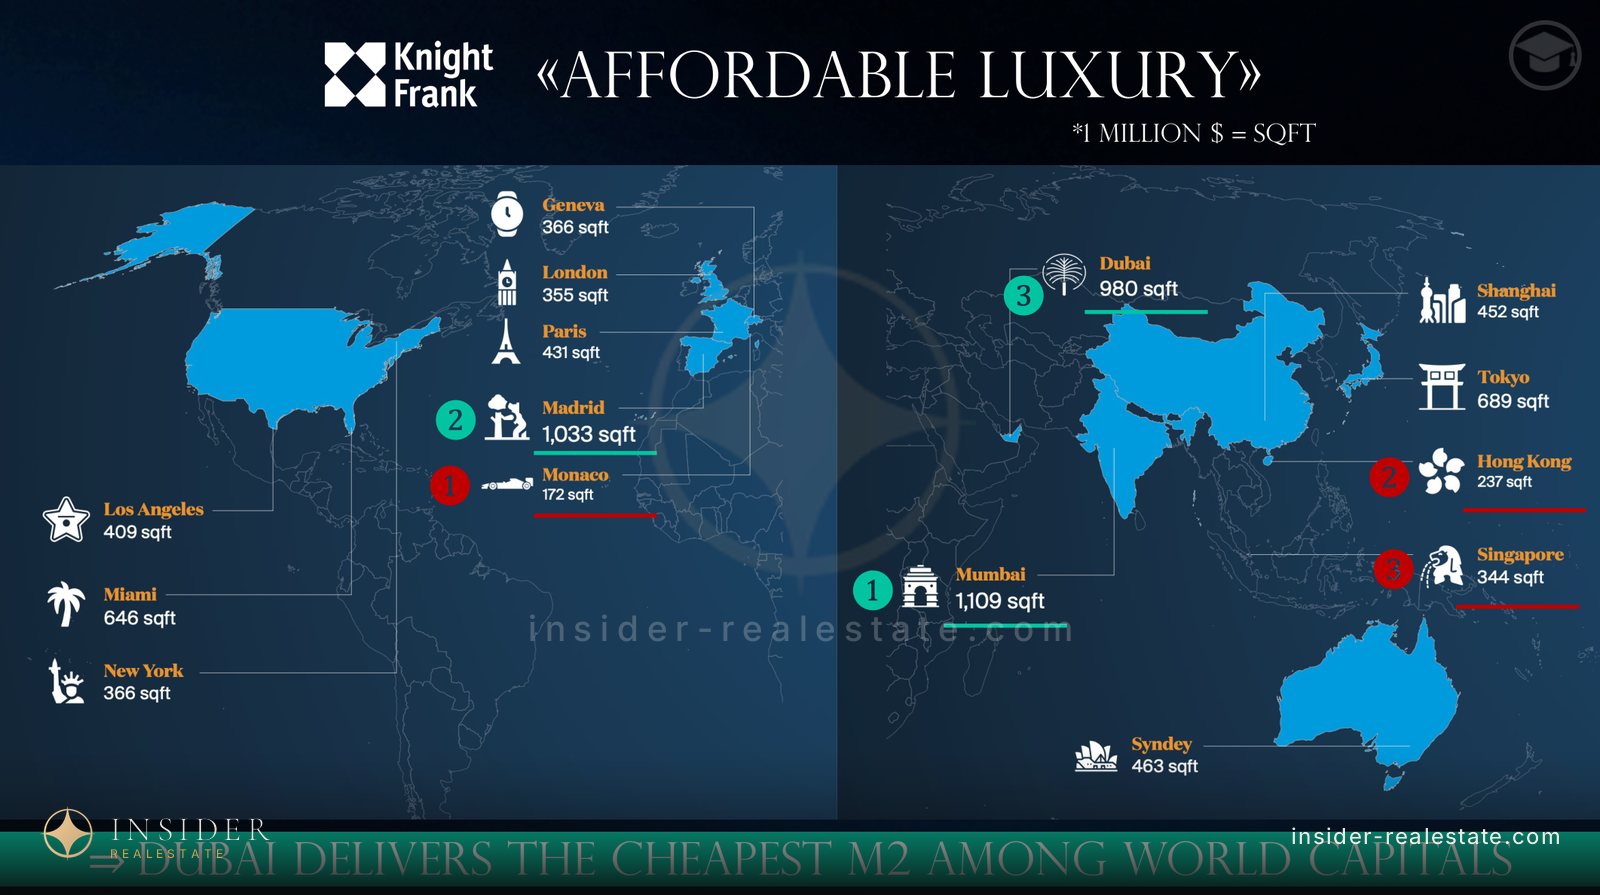
The first argument is the price of a square foot. Knight Frank calculates that a million dollars buys about 980 sq ft of prime housing in Dubai. In Monaco it buys 172, in Hong Kong 237, in Singapore 344, in London 355, in New York 366, in Miami 646. Among global centres only Madrid and Mumbai give more space for the same million.
The second is the trajectory. A million dollars put into prime housing in 2020 would have become $2.7m in Dubai by 2025 and $1.9m in Miami. That is the answer to why a buyer choosing between two warm tax-free cities increasingly picks the first.
The third is the safety of the bet itself. In the UBS Global Real Estate Bubble Index, Dubai does not fall into the overheating red zone that Zurich, Tokyo and Miami occupy consistently. That is not a guarantee of growth, but a real difference in the character of the risk: the market grows on an inflow of people and money rather than on cheap credit.
The fourth is what comes with the square footage. In a Knight Frank survey, wealthy buyers name Dubai’s main advantages as quality infrastructure (54%), its status as a global tourist destination (52%), the choice of investment assets (44%), the absence of income tax (41%) and value for money (40%).
-
What a million dollars buys in different cities Dubai — 980 sq ft. Monaco — 172, Hong Kong — 237, Singapore — 344, London — 355, New York — 366, Paris — 431, Miami — 646, Tokyo — 689. Only Madrid (1 033) and Mumbai (1 109) give more. Knight Frank calculation. -
Dubai against Miami: $2.7m against $1.9m A million dollars put into prime property in 2020 would have grown to $2.7m in Dubai and $1.9m in Miami by 2025. Knight Frank estimate. -
Is there a bubble in Dubai UBS Global Real Estate Bubble Index: red for bubble risk, yellow for overvalued, green for fairly valued. Dubai is not in the red zone. -
Why they choose the city and what they demand of the home On the left, why Dubai: infrastructure 54%, tourist status 52%, choice of assets 44%, no income tax 41%. On the right, what matters in the home itself: parks nearby 88%, a hospital 86%, beach access 84%, a sea view 82%. Knight Frank and YouGov survey.
Dubai’s prime market in numbers
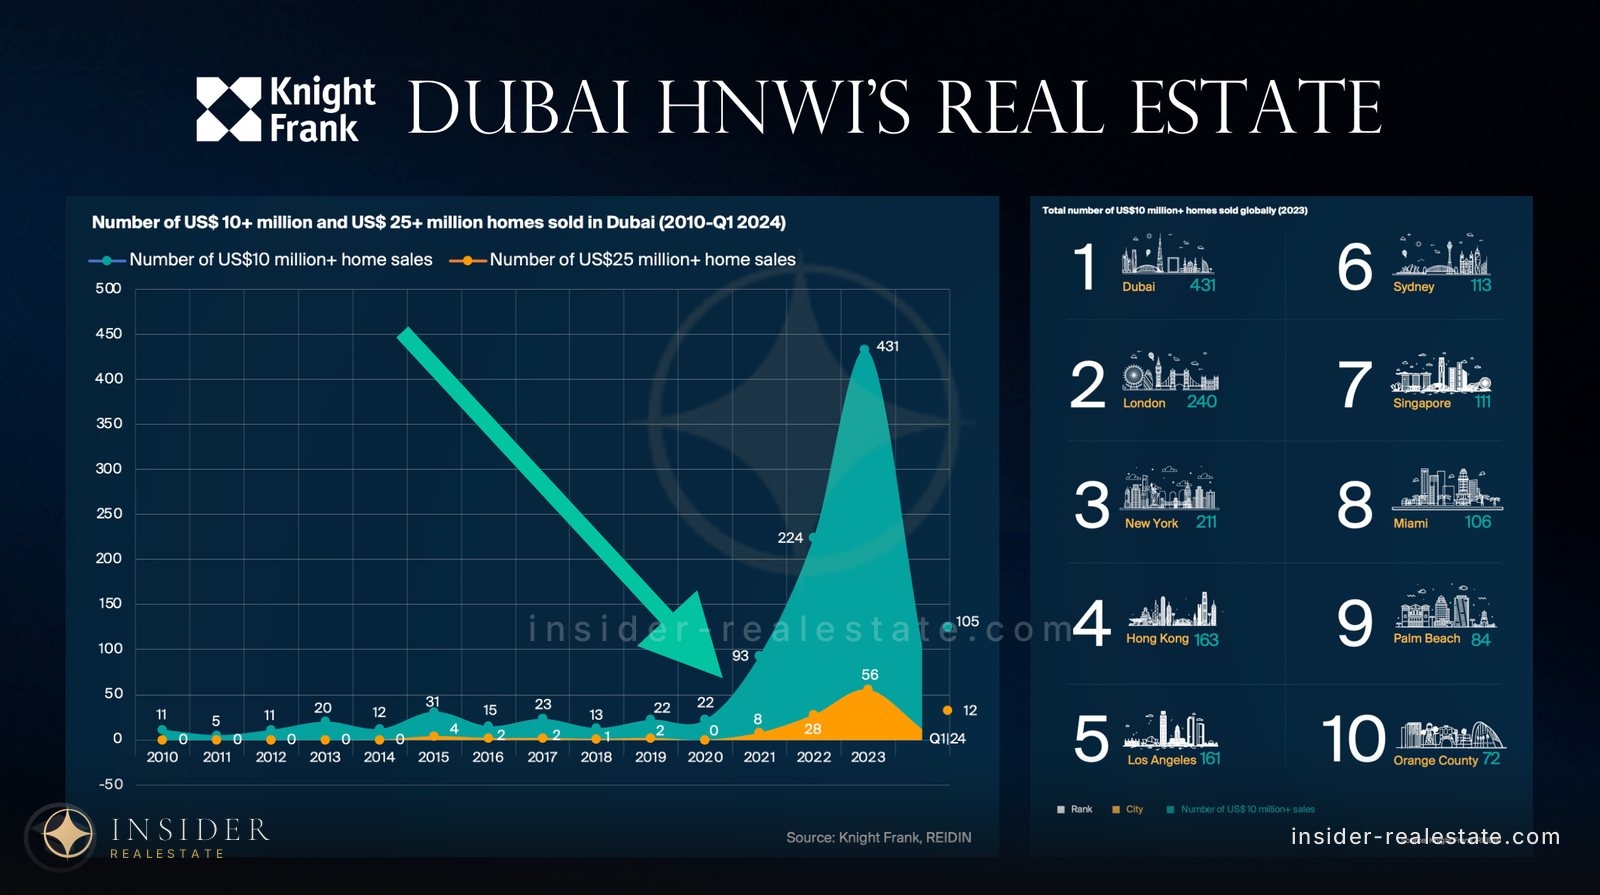
The $10m-plus segment grew explosively. Between 2010 and 2020 Dubai sold between 5 and 31 such homes a year; in 2021 it was 93, in 2022 224, in 2023 431. There were 56 deals above $25m in 2023 against none in 2020. For 2023 as a whole Dubai came first in the world by the number of homes sold above $10m: 431 against 240 in London and 211 in New York.
The geography of that demand is narrow. Almost everything selling above AED 2 400 per sq ft sits in two centres: Palm Jumeirah with Dubai Marina in the west, and the Downtown — Business Bay — Jumeirah Bay cluster in the middle. Outside them, assets at this level appear one at a time.
The gaps within those locations are just as visible. In the first quarter of 2024, 39 of the deals above $10m were on Palm Jumeirah, 10 on Palm Jebel Ali and 7 in Business Bay. By value Palm Jumeirah took 36.3% of the market ($628m), Jumeirah Bay Island 11.1% ($191m) and Dubai Hills Estate 7% ($121m).
Branded residences are their own story. In the Knight Frank survey, 69% of the wealthy respondents would like to buy a branded residence in Dubai; among global HNWI that figure is 83%, and among East Asian buyers 91%. At the same time 56% see a branded residence purely as a capital-growth instrument.
-
From 22 deals in 2020 to 431 in 2023 Sales of homes above $10m in Dubai: 22 in 2020, 93 in 2021, 224 in 2022, 431 in 2023. Deals above $25m: 56 in 2023. On the right, the 2023 world ranking: Dubai 431, London 240, New York 211. Knight Frank and REIDIN data. -
Two centres hold the whole top end Projects above AED 2 400 per sq ft on the DXBinteract map. The first cluster is Palm Jumeirah and Dubai Marina, the second Downtown, Business Bay and Jumeirah Bay. The map tops out at AED 7 460 per sq ft. -
The first quarter of 2024 by district On the left, deal counts: Palm Jumeirah 39, Palm Jebel Ali 10, Business Bay 7. On the right, shares by value: Palm Jumeirah 36.3% ($628m), Jumeirah Bay Island 11.1% ($191m), Dubai Hills Estate 7% ($121m). -
Branded residences: what the survey showed 69% of the HNWI surveyed would like to buy a branded residence in Dubai, rising to 83% among global HNWI and 91% among East Asian buyers. 56% see it purely as a capital-growth instrument. -
The top end is almost always on the water The coastline from Palm Jebel Ali to Dubai Islands with prices by project. Practically all of Dubai’s ultra-prime is front line: a beach, a marina or a view over the bay.
Resale cases: what grew and what did not
This is where buying into an expensive project parts company with making money. In Royal Atlantis individual units resold at between +69% and +119.9%, in Bulgari Residences up to +162%, in Lana by Dorchester Collection up to +167%, and in One at Palm Jumeirah up to +169%.
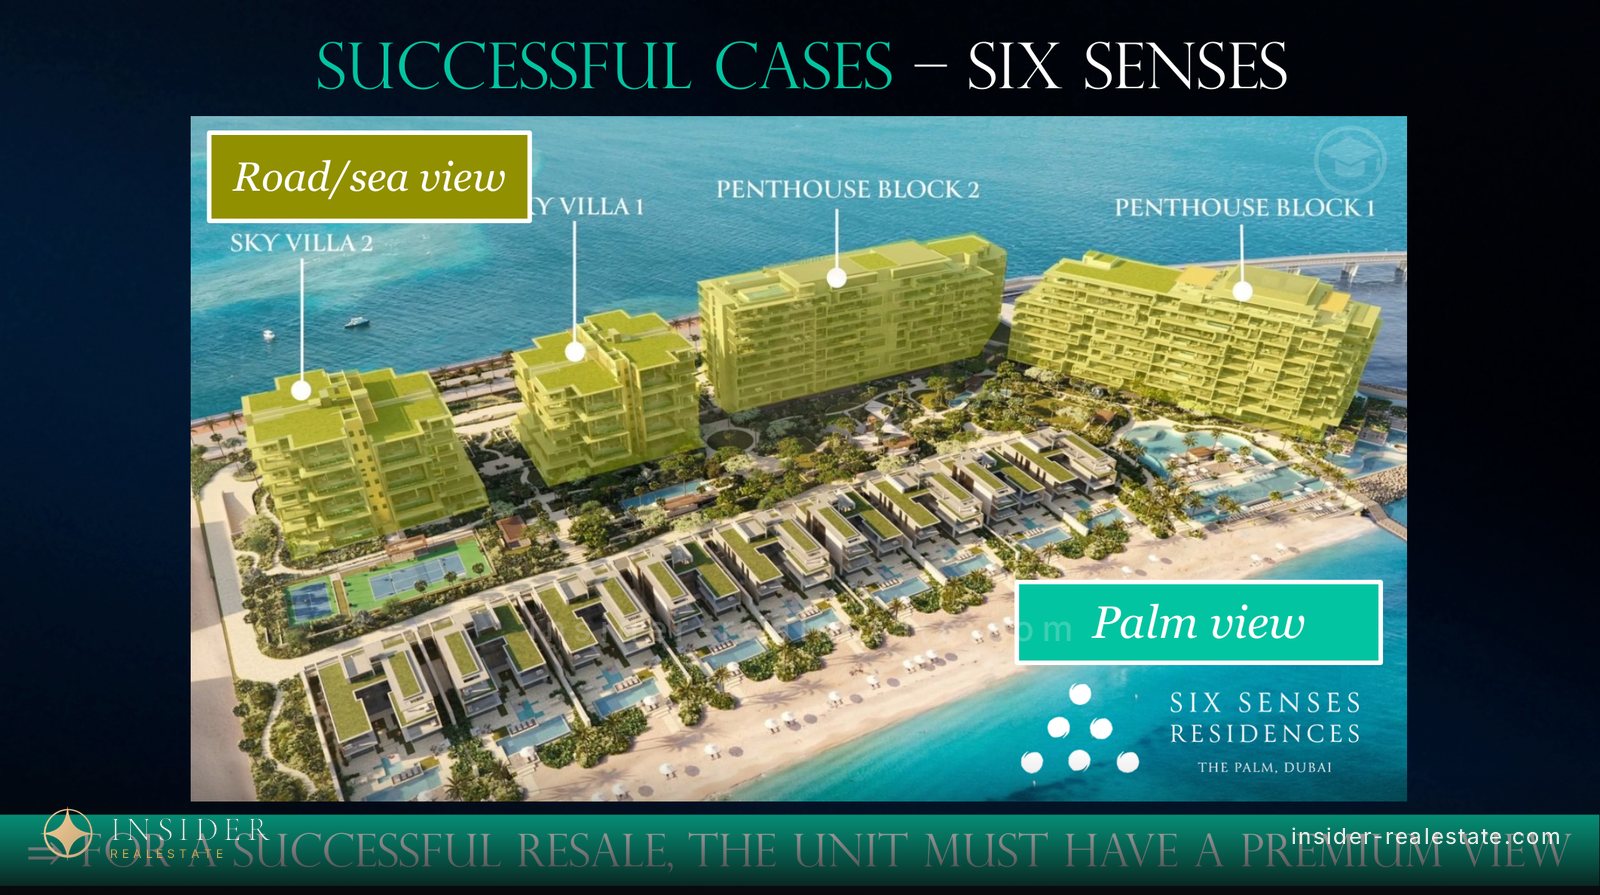
But the spread inside a single project is no smaller than the spread between projects. In Six Senses Residences, apartments facing the Palm added +39% and +41%, while units of exactly the same size facing the road added +12% and +15.9%. The villas tell the same story: +49% against +12%. The conclusion is simple and unwelcome for anyone buying off a floor plan: a unit needs a premium view to resell well.
The second factor is whether the location is finished. Resales at Mr. C Residences on the Dubai Water Canal went the other way: −15% and −16%. The project is good, but what surrounds it has not been built — The Rings by PMR, Melgrano, Sea Mirror, Peninsula by H&H and Canal Front Residences were all unfinished at the time of the analysis. A top-end buyer pays for the surroundings, not for the excavation next door.
At the very top the numbers run into hundreds of millions of dirhams. In 2024 the most expensive apartment was a unit in Bayview at Marsa Dubai at AED 531m, and the most expensive villa a house on Palm Jumeirah at AED 203m.
-
The view decides more than the floor area Six Senses Residences on the Palm: units facing the Palm resold at +39% and +41%, comparable units facing the road at +12% and +15.9%. Among the villas the gap is wider still: +49% against +12%. -
When the location is not ready Mr. C Residences on the Dubai Water Canal: resales at −15% and −16%. The neighbouring canal projects were unfinished at the time of the analysis, and the surroundings the top end pays for had not come together yet. -
The five biggest deals of 2024 Apartments: Bayview at Marsa Dubai — AED 531m, One at Palm Jumeirah — AED 275m, Bulgari Lighthouse — AED 148m. Villas: Palm Jumeirah — AED 203m, Hadaeq Sheikh Mohammed Bin Rashid — AED 200m. DXBinteract data. -
Fifty thousand more people a year Dubai’s population: 1.32m in 2005, 3.55m in 2022. The Dubai 2040 plan sets 7.8m, a two-and-a-half-fold increase. Apartment completions: 26k in 2024, 37k in 2025, 28k in 2026. Sources: Dubai Statistics Center and DXBinteract.
Prime Dubai on camera
The assets the numbers above are about, filmed on site: the Opera District penthouses, the branded residence beside the Burj, twenty-two villas on a Palm frond, the Business Bay building with a waterfall in every flat, and the city's most expensive office floors. Each clip has a written breakdown of its own here.
 34:38Interior design in Dubai: neuroarchitecture, longevity design and soulful luxury explained8 October 2026
 56:22Villa restoration in Dubai: what marble, wood and furniture repair costs in luxury homes4 October 2026
 25:11Crystals in interior design: how a Dubai designer maps a space with stones and paintings3 October 2026
 10:32Lumena Alta by Omniyat: Dubai’s most luxurious office tower12 October 2025
 3:26Il Primo penthouses: the top of the Downtown market16 May 2024
 23:55Baccarat Dubai: the branded residence next to the Burj16 December 2023
 12:00XXII Carat on Palm Jumeirah: 22 Mediterranean villas compared with Raffles and Zabeel Saray20 September 2023
 22:01EYWA in Business Bay: 48 apartments built to Vastu Shastra, with a waterfall in each15 July 2023


Find something at the top of the market
Tell me the budget and the purpose — to live in, to let, or to hold capital. I will show what is available in those two centres right now, off-market included, and say plainly where a resale is going to be hard.
Ask a question
Telegram is the fastest way — I answer personally.
Message on Telegram